
01
Sprint timing
0–60 mph, rolling ranges and targets of your own. Up to three values stay in view live.

Inside the app
Ten central views in the order you actually use them – from live measurement to analysis.
01
0–60 mph, rolling ranges and targets of your own. Up to three values stay in view live.
02
The quarter mile, 400 m and 1000 m run in parallel – each with terminal speed and timestamp.

03
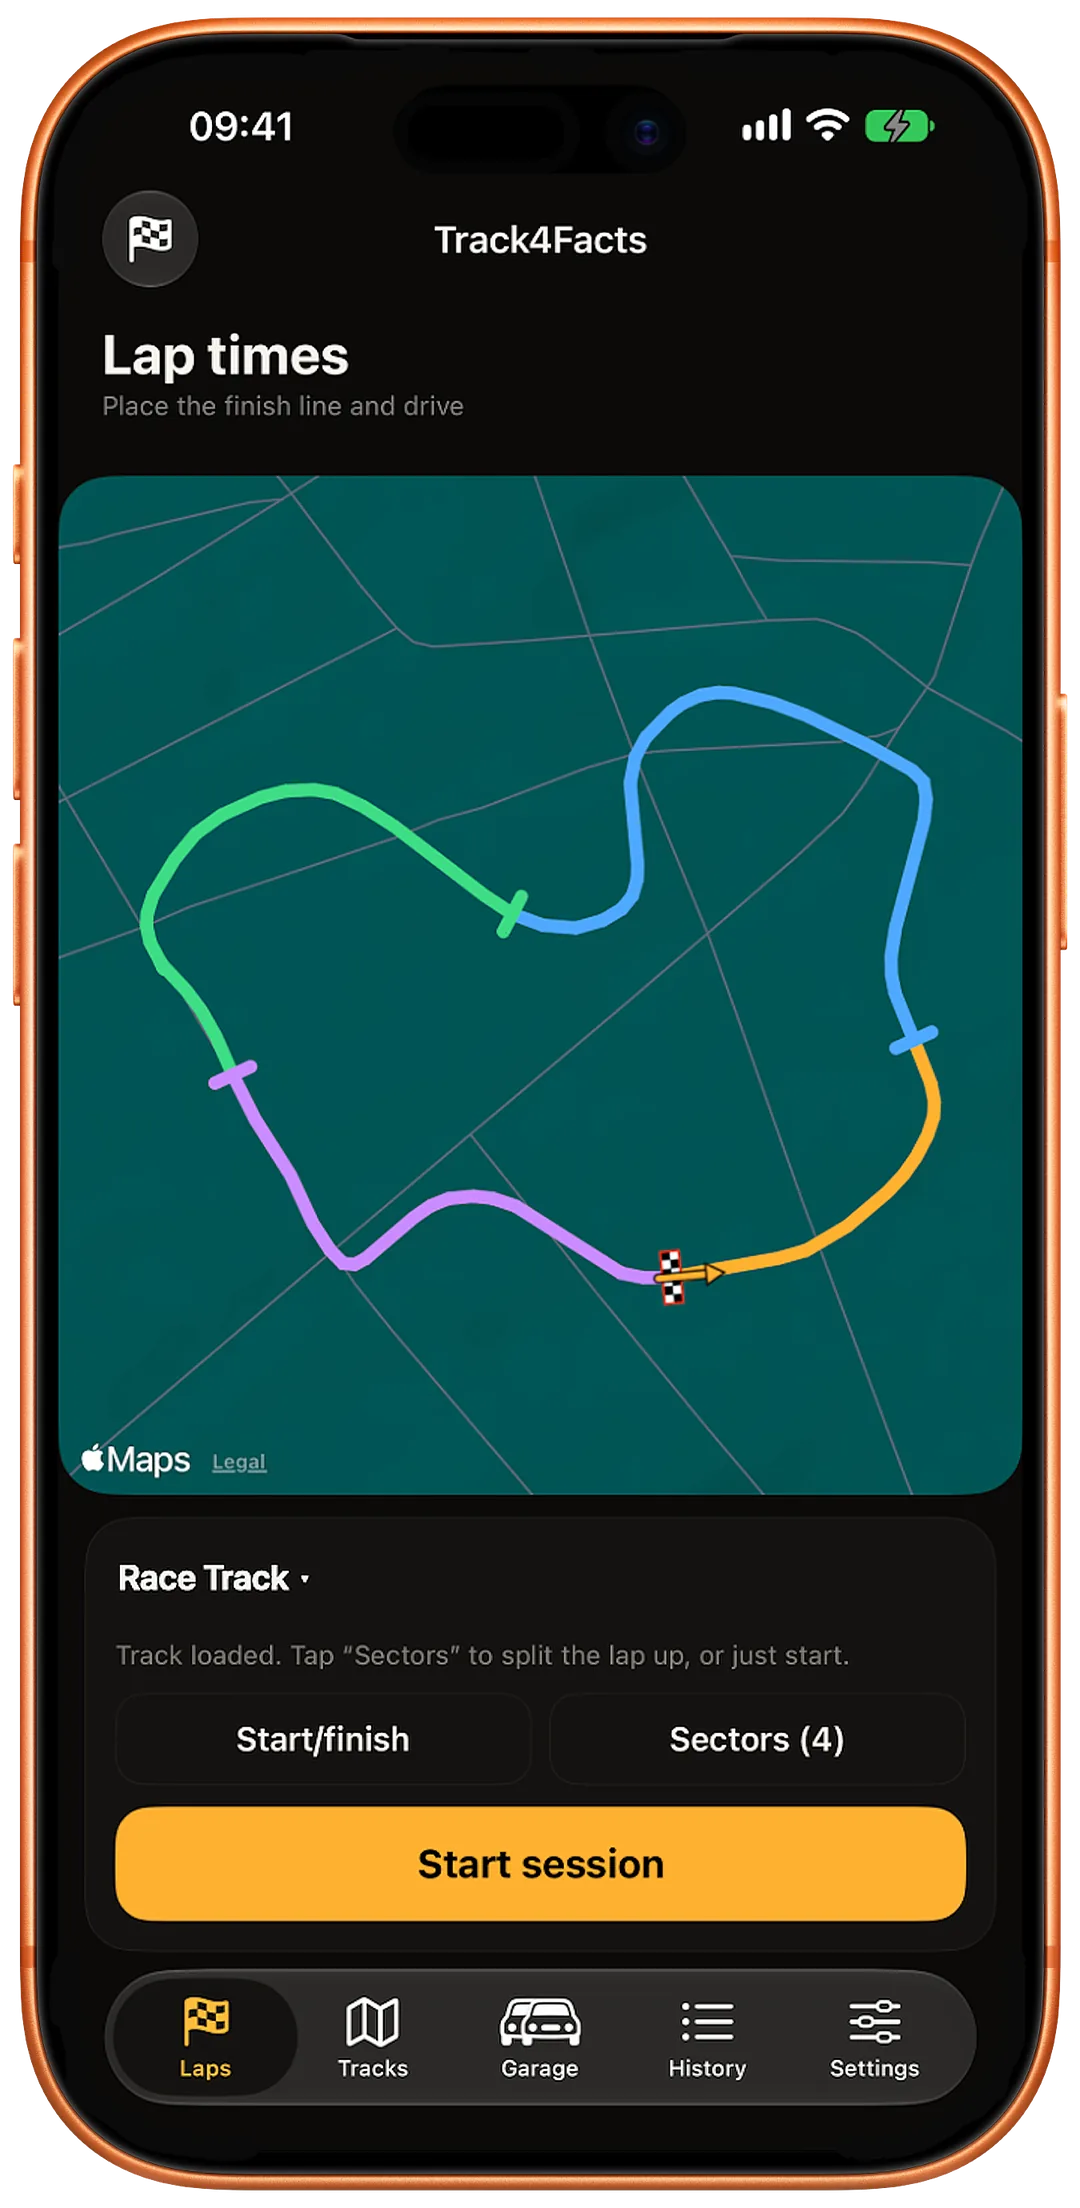
Draw the circuit or drive it, then set start/finish and as many sectors as you like.
04
The current lap against your best at the same metre of the course. Green means faster.

05
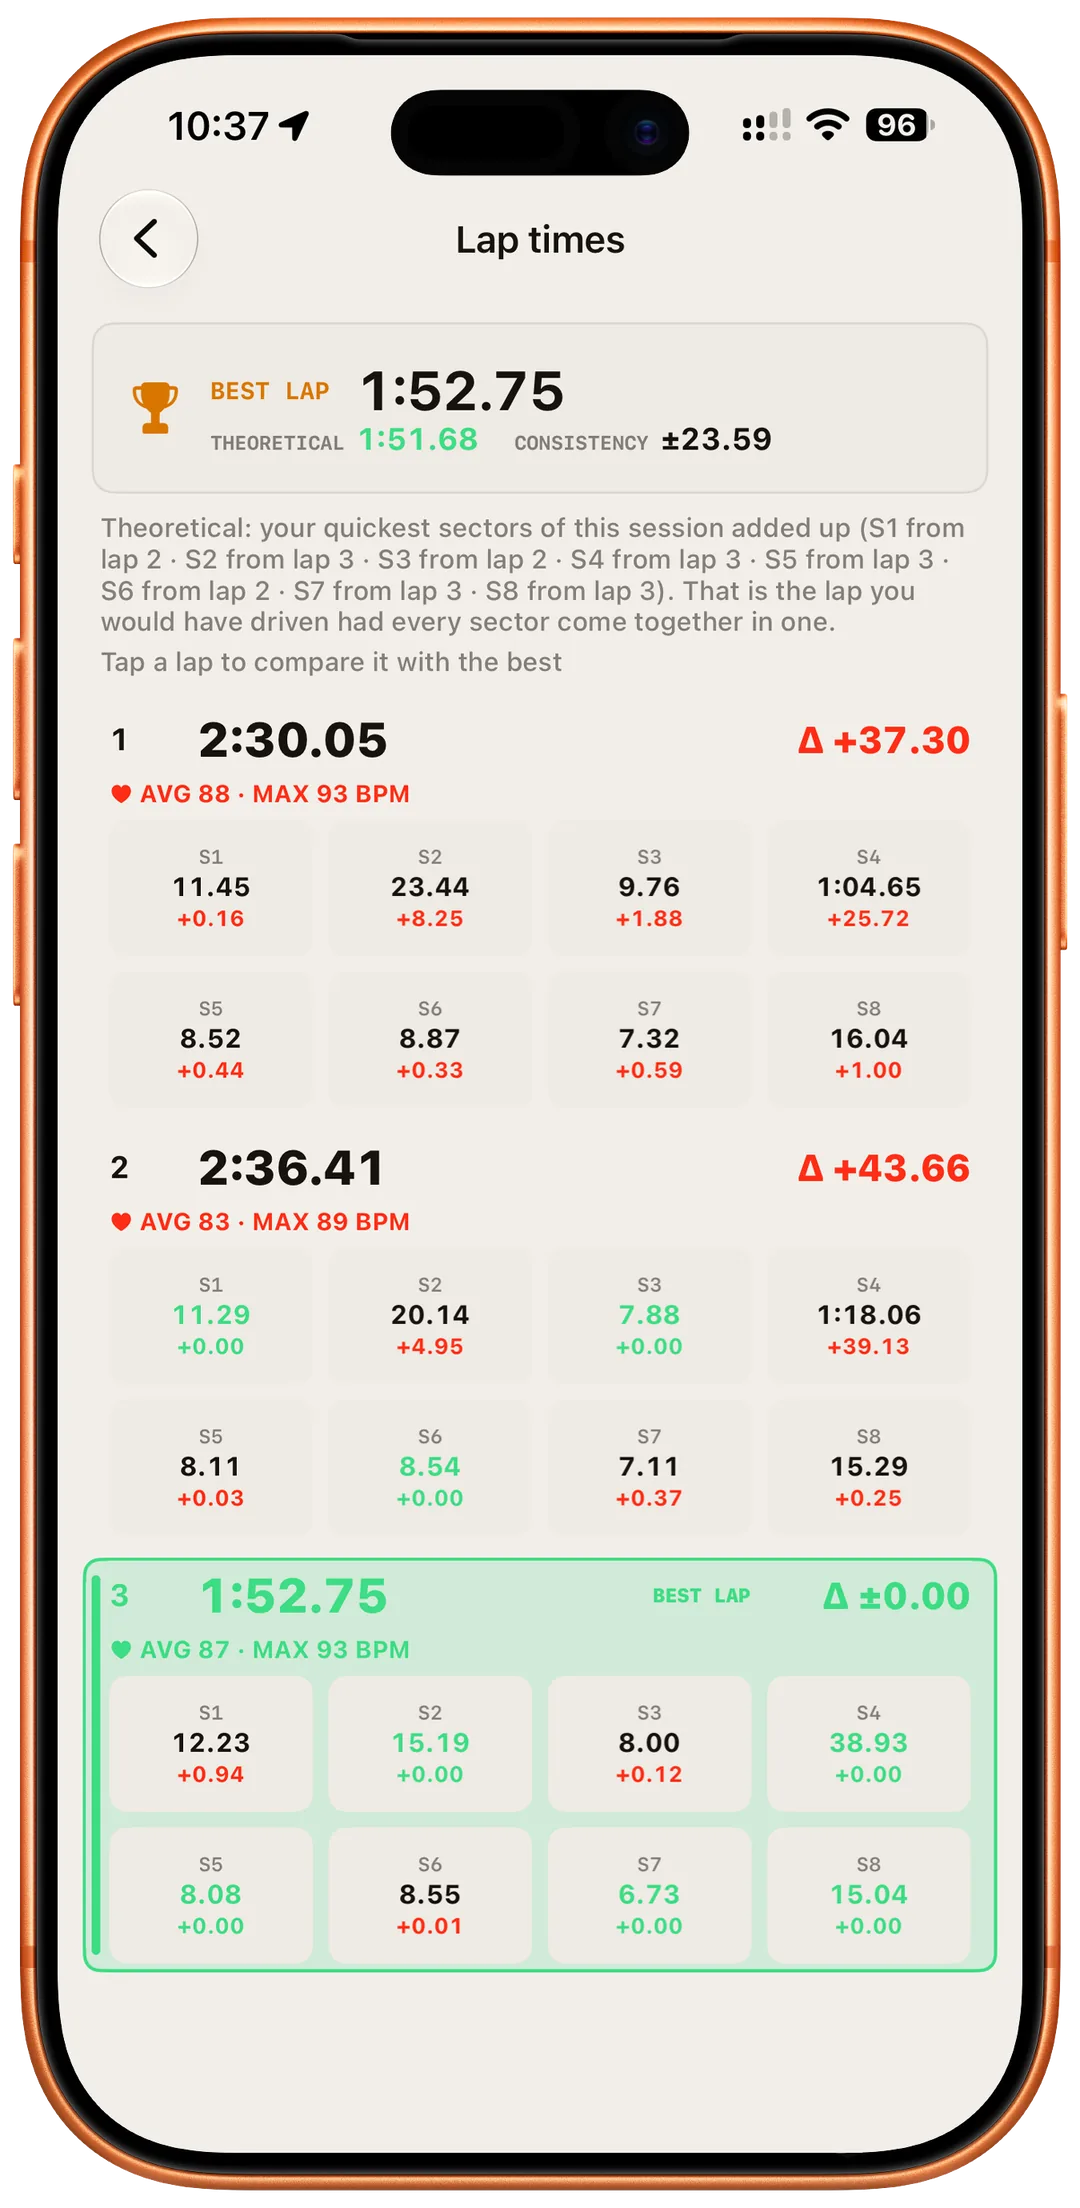
Every lap with sector times, best lap, theoretical lap and consistency.
06
Two laps over distance: where slowing begins and where the time is lost.

07
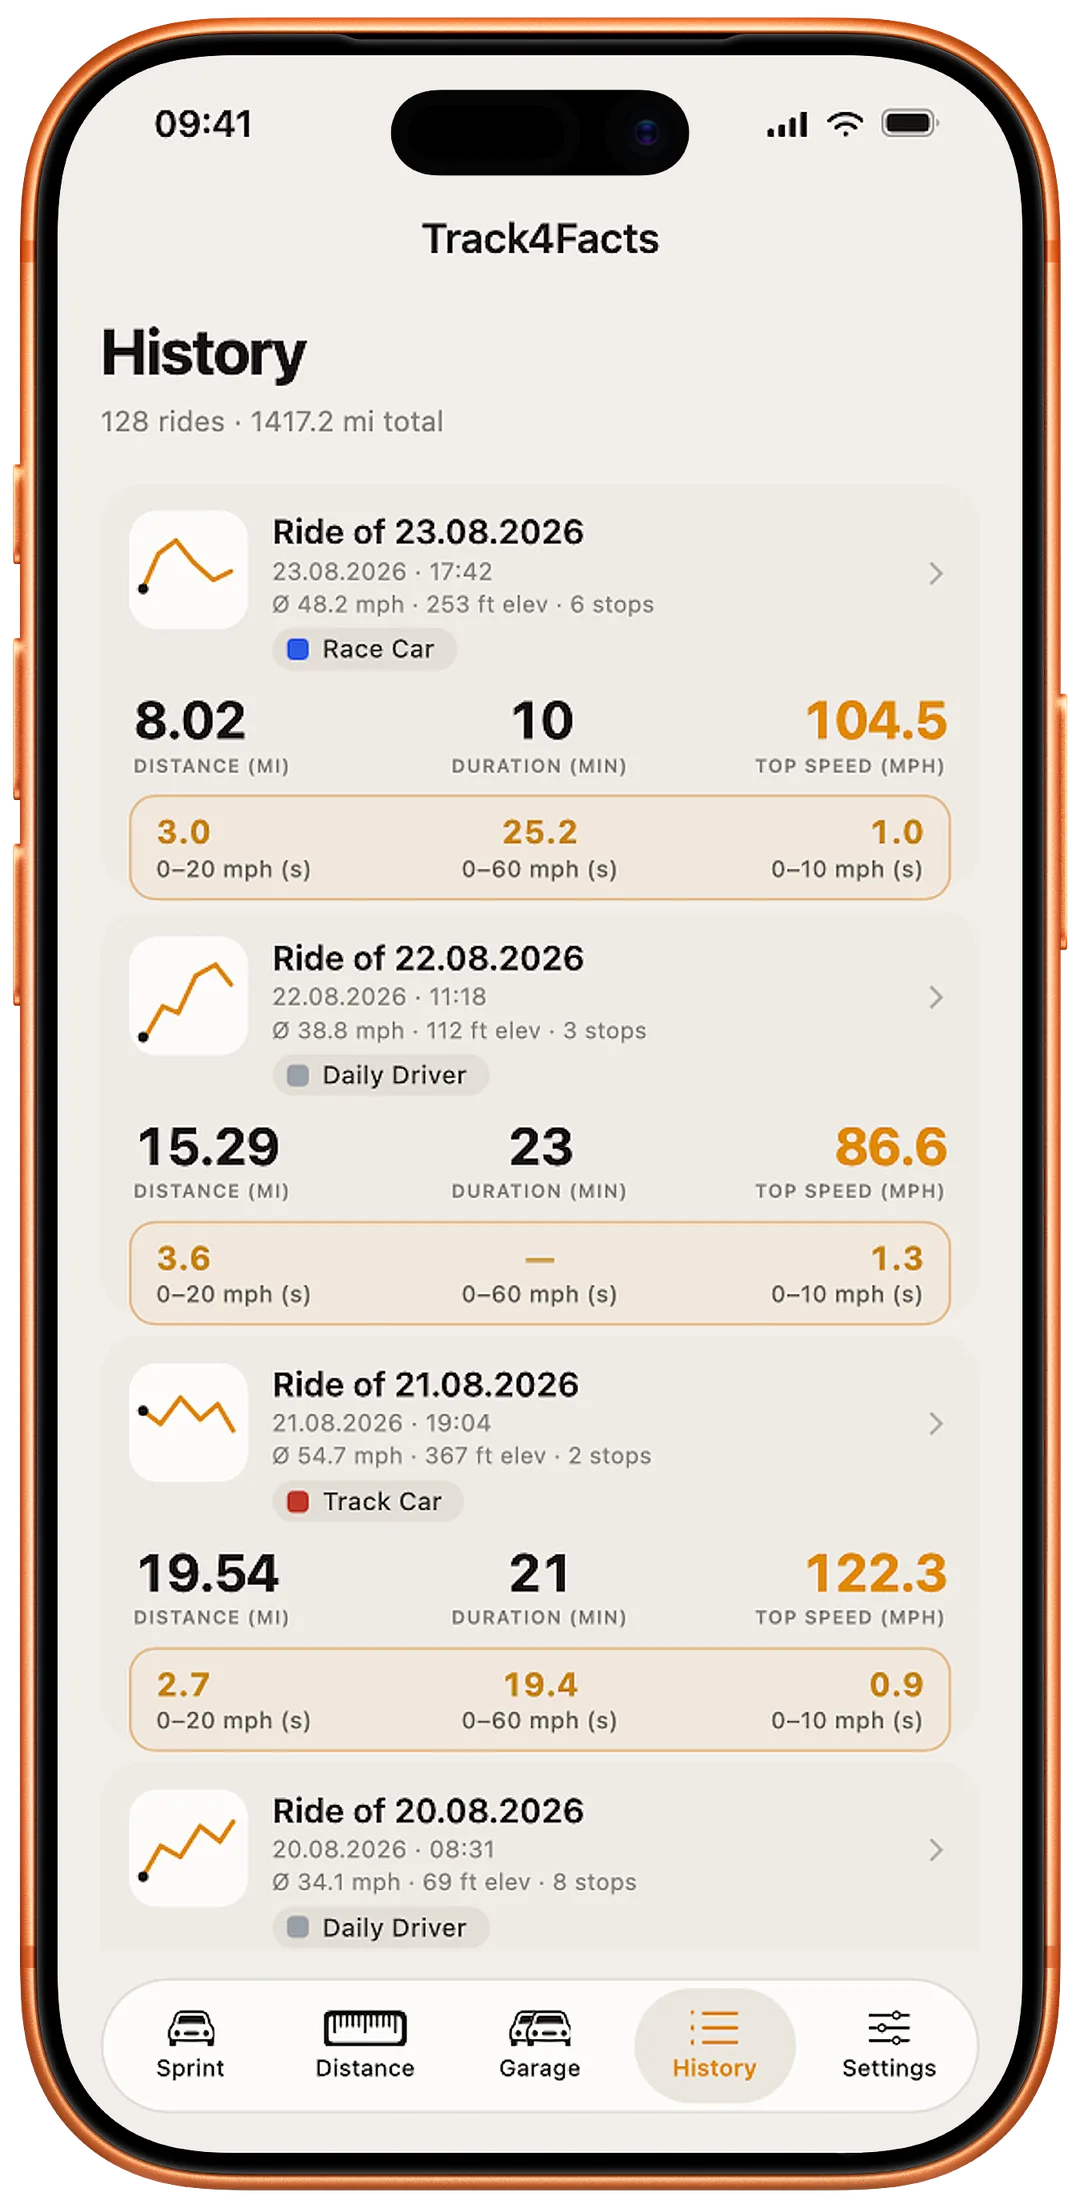
Every drive with map, ride data and personal bests – permanently and locally.
08
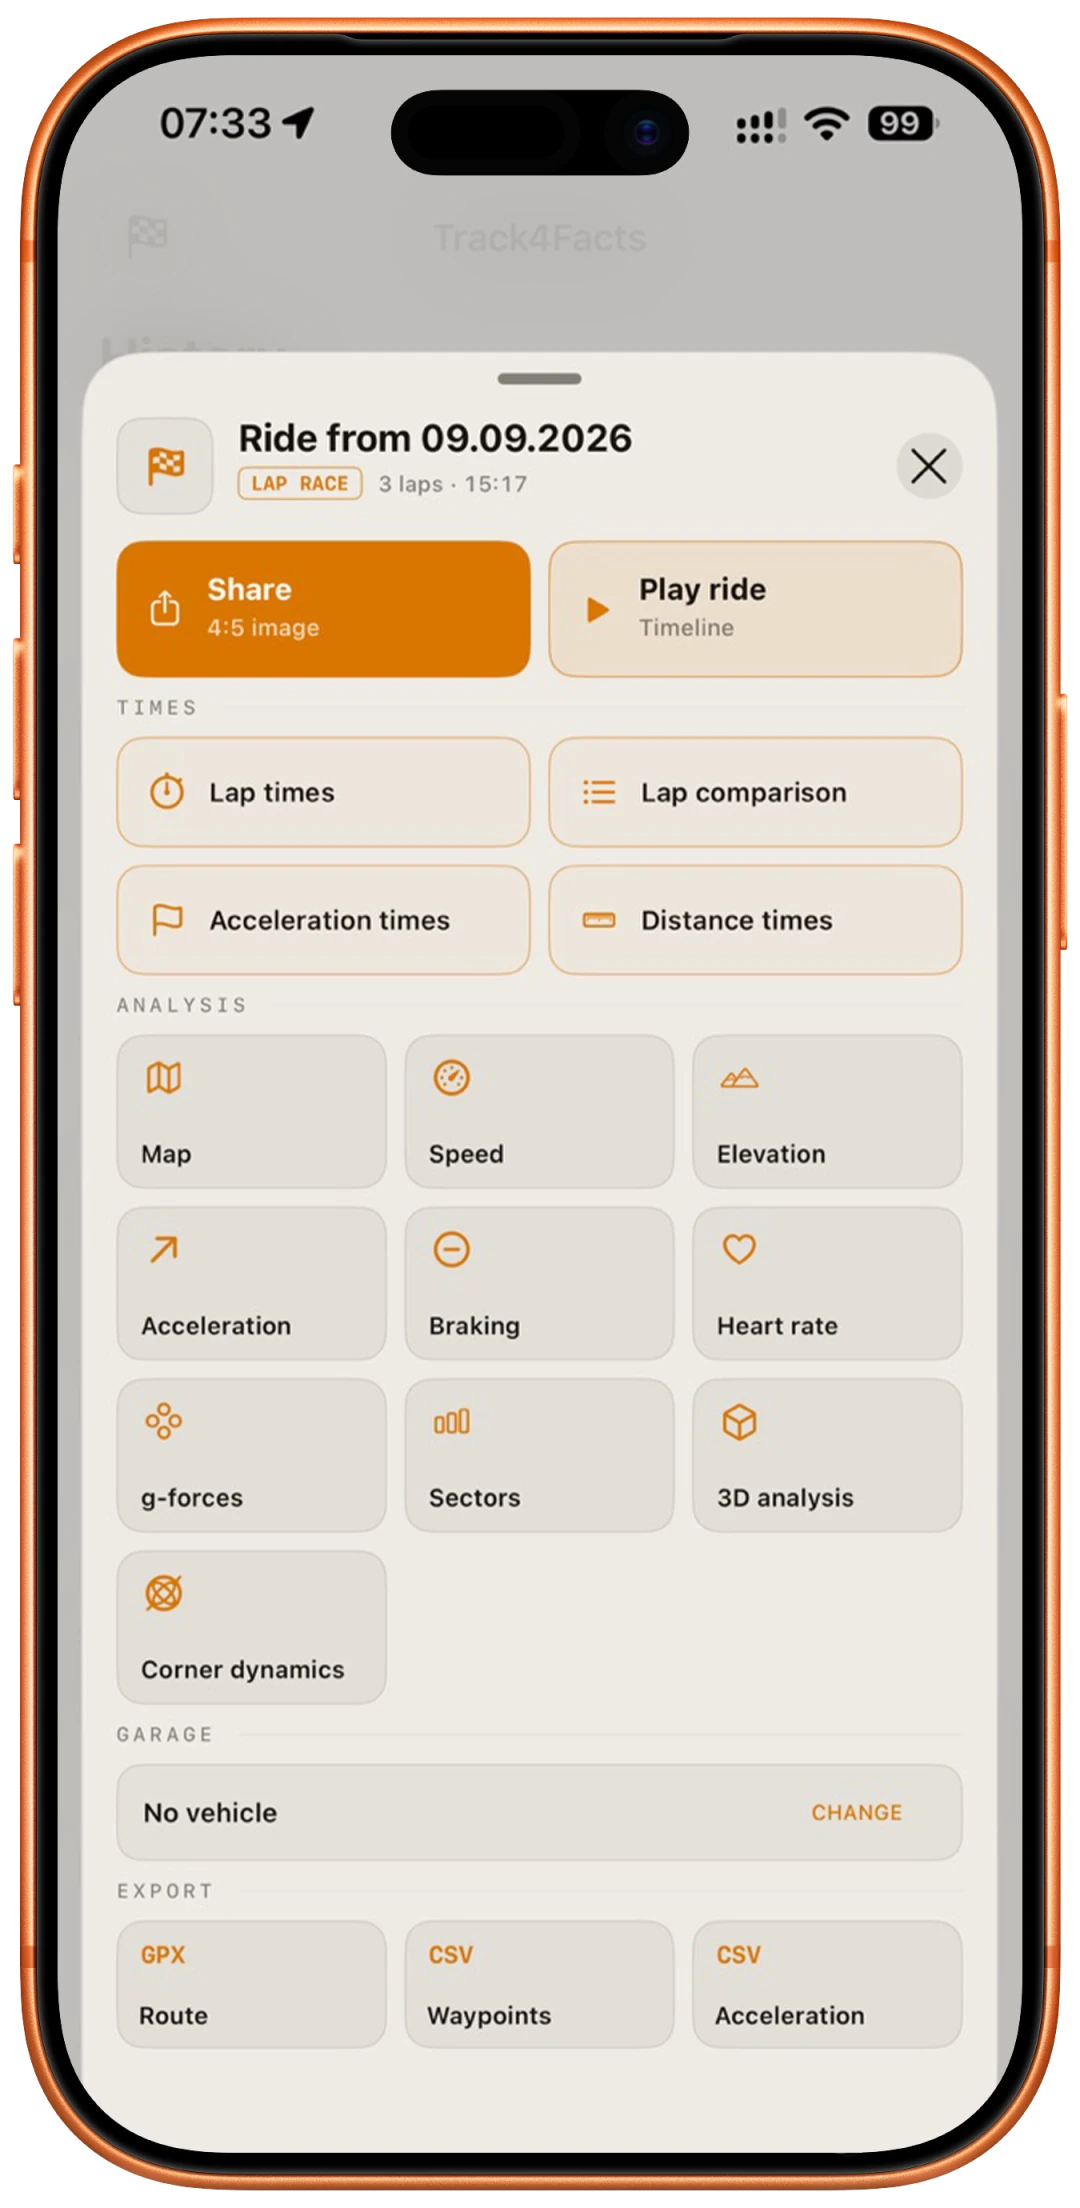
Open charts, assign a vehicle, export, or share as a race summary.
09
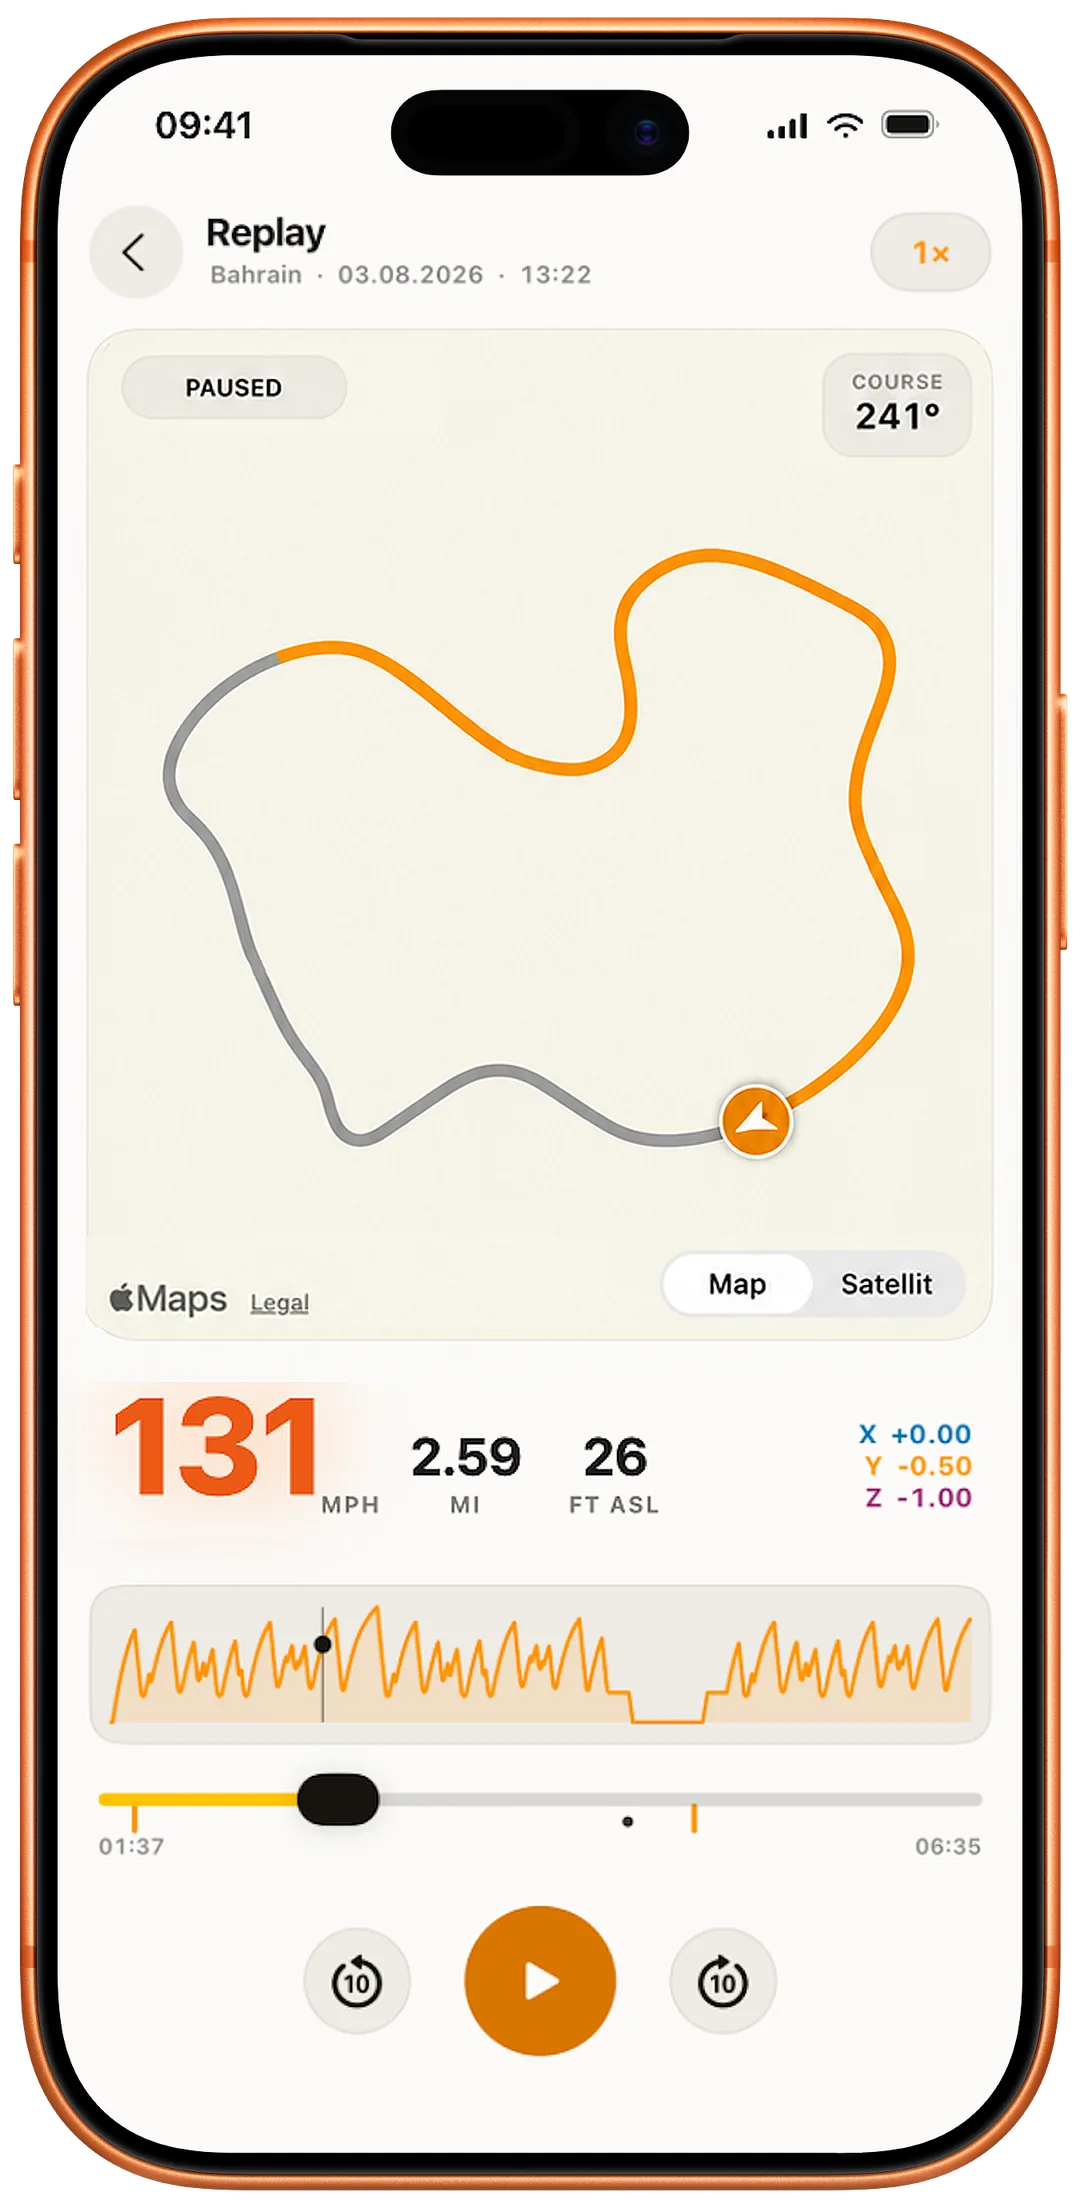
Play back position, speed, altitude and g-forces along the recorded route.
10
Longitudinal and lateral force from two independent methods, moment by moment.
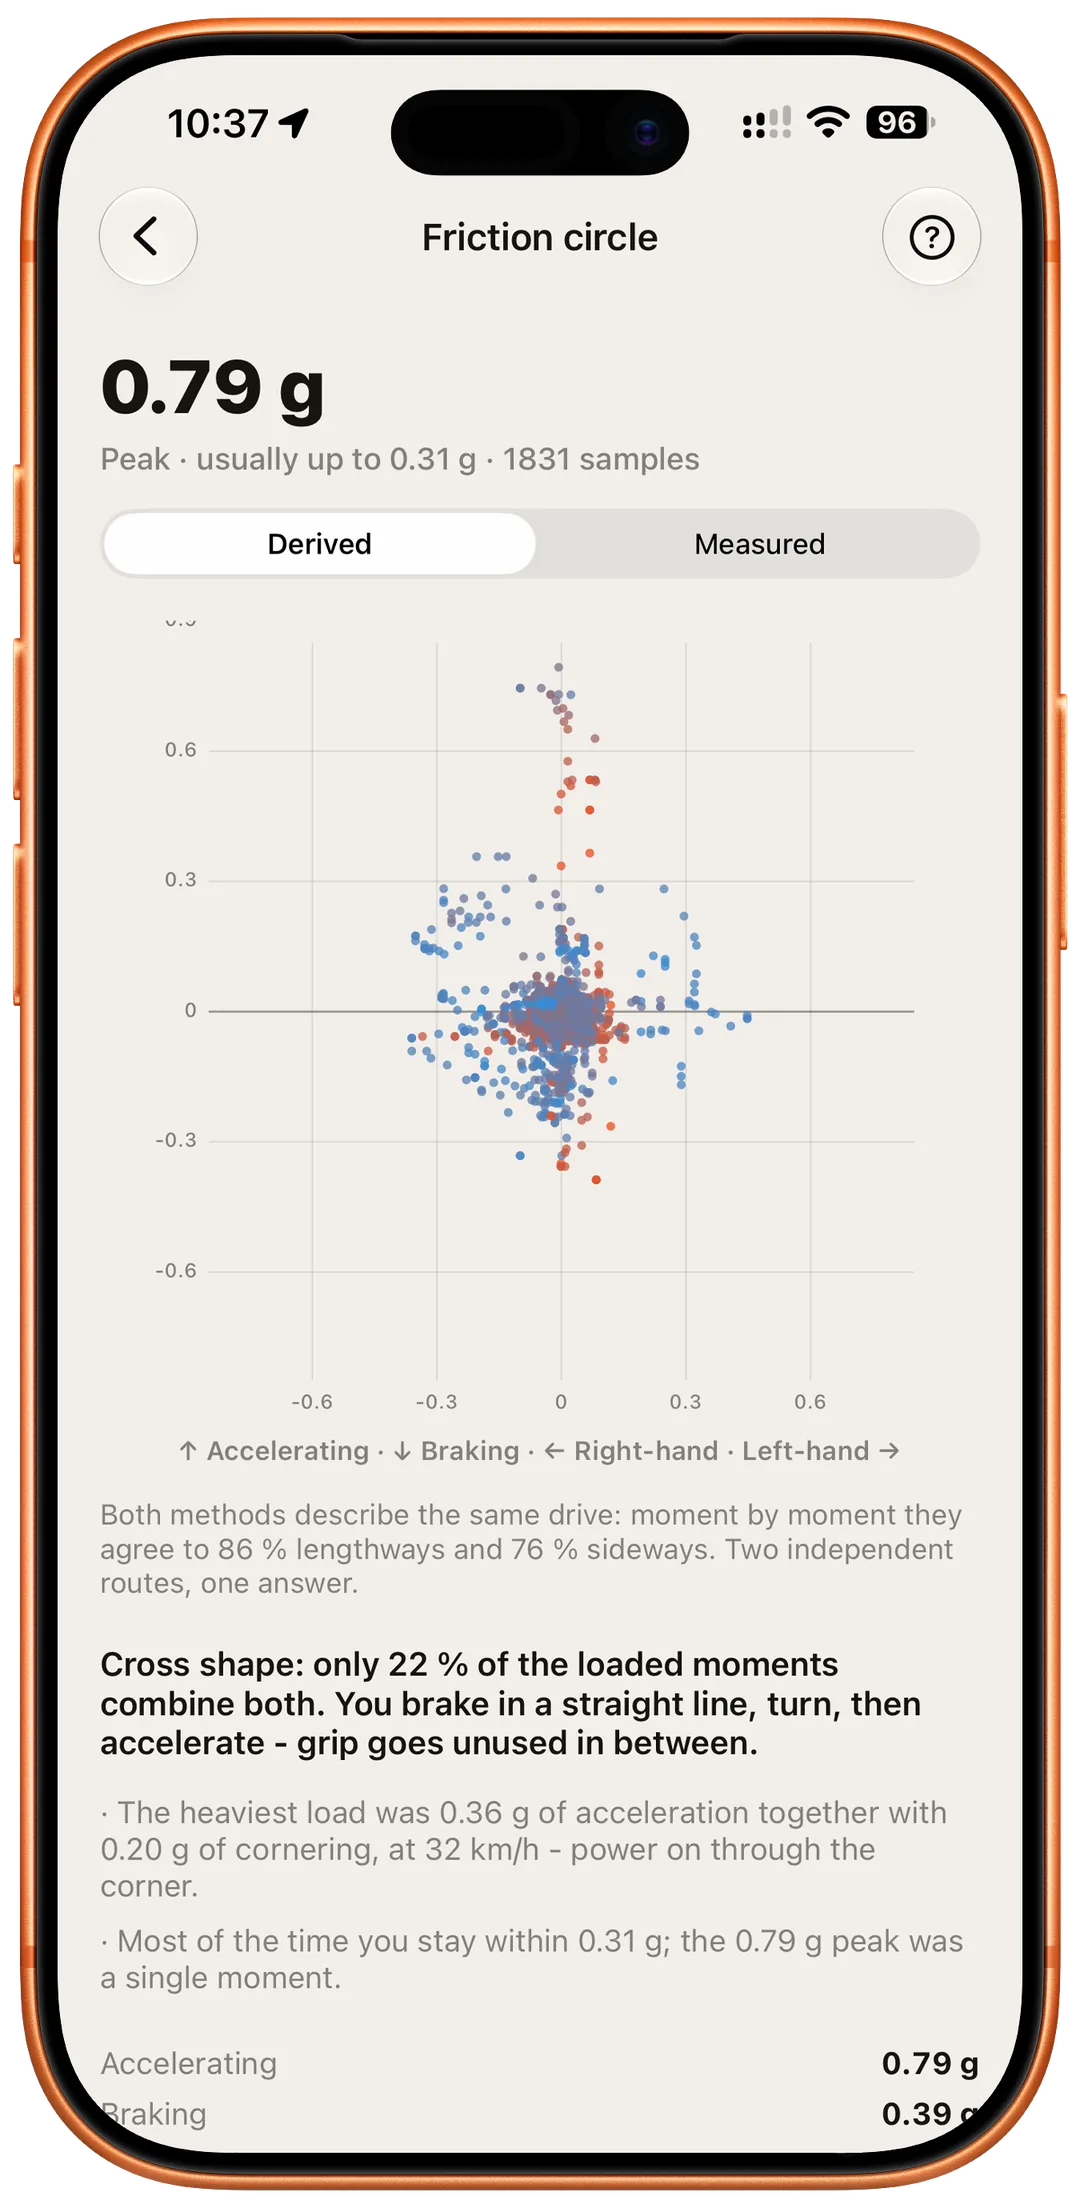
The measurement page starts with a short explanation and opens formulas, limits and failure cases on request.