
Measurement
Understandable first. Then exact.
Track4Facts turns GPS and sensor data into results you can verify. You get the short answer first – and open formulas and edge cases only when you need them.
In short
The app never claims more than the data supports.
A reading is not a single GPS coordinate. Track4Facts looks at a connected sequence, tells standstill from motion, checks jumps and data gaps, and computes the actual moment a speed, distance or line is crossed. Good conditions are marked green, increased uncertainty yellow. If a result is not sound, the app shows the reason instead of an invented number.
Three terms, kept separate: “Measured” comes directly from GPS or motion sensors. “Calculated” is derived from those values using the models documented below. “Displayed” may be smoothed or vertically exaggerated for legibility – but never changes the stored measurement.
Technical detail
As deep as you want to go.
Every section starts closed. Open only the topic you want to check right now.
DATASources, fix validation and standstill
Through Core Location the iPhone reports position, GPS speed and usually horizontal, vertical, speed and course accuracy. Dragy Lite additionally reports satellite count and pDOP. XGPS does not provide the same accuracy fields for every point; there Track4Facts checks fix, measurement age, continuity and plausibility instead.
Standstill is confirmed, not assumed
The shared tolerance is 3 km/h. A single low or jumping value is not enough. On the iPhone at least two low, spatially stable points confirm the transition. Faster external sources use a short time-based window with several plausible points.
Adjustable quality limits
The recommended starting values are 15 m horizontal accuracy, 30 m altitude accuracy, 15 km/h speed accuracy and 0.20 g maximum tolerated disagreement in the sensor comparison. These are deliberately adjustable product defaults – not limits prescribed by Apple or by a measurement standard.
A higher sample rate resolves transitions more finely, but is not automatically more accurate. Reception, antenna position, reflections and satellite geometry remain decisive.
SPRINTTime to speed
The target speed almost always falls between two GPS points. Track4Facts derives the crossing moment linearly from the two valid neighbouring values:
For 0–X the attempt only arms after a confirmed standstill. For rolling ranges such as 50–75 mph the lower threshold must first be crossed from below. Data gaps and a change of GPS source are not bridged.
DISTANCEDistance from speed and time
Between two time-stamped measurement points the app integrates speed using the trapezoidal rule. That avoids the crude assumption that speed stayed unchanged across the whole interval:
Inside an interval the app assumes linearly changing speed, hence constant acceleration. Distance therefore grows quadratically with time. For the remaining distance s* it solves the stable positive root:
τ = 2s* / (v₁ + √(v₁² + 2as*))
If a is effectively zero, τ = s* / v. Speeds are converted to m/s and τ is clamped to the valid interval. Several distances can finish in parallel. A configured rollout counts towards physical distance but not towards the reported timed interval.
LAPSLine crossing, sectors and live delta
Start/finish is a directed line. A crossing only counts if the movement segment intersects the line in the defined direction. The intersection fraction q within the GPS segment gives t* = t₁ + q · (t₂ − t₁). The first valid crossing starts the lap, every further one completes it.
Laps under ten seconds or 30 metres are discarded. The car must also have moved at least 15 metres away from start/finish and motion must be confirmed in at least two points. Data gaps longer than five seconds and a change of position source are not bridged.
Compared at the same distance
Live delta and later analysis compare both laps at the same metre of the course. The costliest section is found using a sliding 100-metre window. Standstill is reported separately, because it produces time but no distance.

ANALYSISTheoretical lap, consistency and corners
The theoretical lap is the sum of the fastest sectors of a session. It was not necessarily driven in one go, but every part value is evidenced. Consistency is the empirical standard deviation of complete lap times.
For corner analysis Track4Facts places the trace on a five-metre grid and smooths it over 25 metres. A speed drop of at least 12 km/h is recognised as a corner. "Slowing starts" marks the point two km/h below the previous straight-line level – deliberately not necessarily a braking point.
BRAKINGBraking analysis and a corner’s time effect
The analysis uses fixed corner anchors for the entire session. A candidate must occur in at least two laps; nearby observations are clustered within 50 metres. In a comparison, an individual lap’s corner may be no more than 80 metres from the anchor. Excluded or incomplete corners therefore stay visible and the selection cannot silently move from lap to lap.
Two onsets – never mixed
Without suitable sensor data the app shows where speed starts to fall: two km/h below the preceding smoothed level. This can mean braking, but also lifting, drag or gradient. With reliable motion data it can additionally determine the confirmed onset of negative longitudinal acceleration. A sensor onset is never subtracted from a speed-derived onset.
Time gained or lost
Both laps are compared at the same course distance. The corner effect is the change in time delta from the entry to the end of the analysis window:
Standstill or a recording gap inside the corner window invalidates the comparison. A sensor braking zone is only assigned to a following corner when it starts no more than 250 metres before the apex and no later than five metres after it.
DYNAMICSYaw, roll and pitch rate
The gyroscope reports rotation vector ω in phone coordinates. The normalised gravity vector ĝ gives rotation around the vertical axis. Roll and pitch only appear after vehicle-forward axis f has been fitted plausibly by comparing sensor acceleration with GPS longitudinal or lateral acceleration; l is the resulting vehicle-left axis.
roll = ω · f × 180/π
pitch = −ω · l × 180/π
At least 50 valid motion readings are required. Rates above 360°/s are rejected as implausible and curves use a five-reading median. The displayed typical strong values are the 95th percentile, not the most sensitive single peak.
When is quality “good”?
The app requires at least 10 Hz, a fitted vehicle axis, no detected phone movement and – where comparable GPS lateral force exists – an absolute correlation of at least 0.35. GPS and gyroscope pairs may be at most one second apart. A phone attitude change over 20° within no more than 0.5 seconds is flagged as possible movement.
A firmly mounted iPhone approximates chassis motion. Without steering angle the analysis cannot identify oversteer or understeer. Road camber, tyres, suspension and mount influence the readings; this is not a replacement for suspension-travel, ride-height or laboratory sensors.
3DCourse model, elevation and colour coding
GPS coordinates are projected into a local metric coordinate system. Position and speed are averaged in a short time window of about ±0.16 seconds. Points below 1.5 km/h are not drawn as driven path; real recording gaps visibly split the ribbon. Long series are progressively reduced in geometric density without closing gaps.
Elevation is smoothed and openly exaggerated
GPS altitude is substantially noisier than horizontal position. The view therefore averages it over about five seconds, accepts only plausible altitudes from −500 to 10,000 metres and limits the display to the 5th–95th percentile range. Relief is used only when at least two metres of usable altitude range remain. If it would otherwise be hard to read, it is exaggerated by an integer factor up to 6× and labelled accordingly; without useful altitude the course stays flat.
Colour is acceleration, not pedal state
|g_long| ≤ 0.04 → approximately steady speed
g_long > +0.04 → accelerating
Colour prefers motion-sensor data and falls back to GPS speed changes. It does not report throttle or brake-pedal position. The 3D view is a technically traceable visualisation of the stored drive, not an additional measurement source.
G-FORCEFriction circle from two independent methods
Lateral force runs horizontally, longitudinal force vertically. The distance from the origin shows the combined demand on tyre grip. A cross-shaped cloud is entirely normal on public roads; a more filled circle shows combined braking, steering and accelerating.
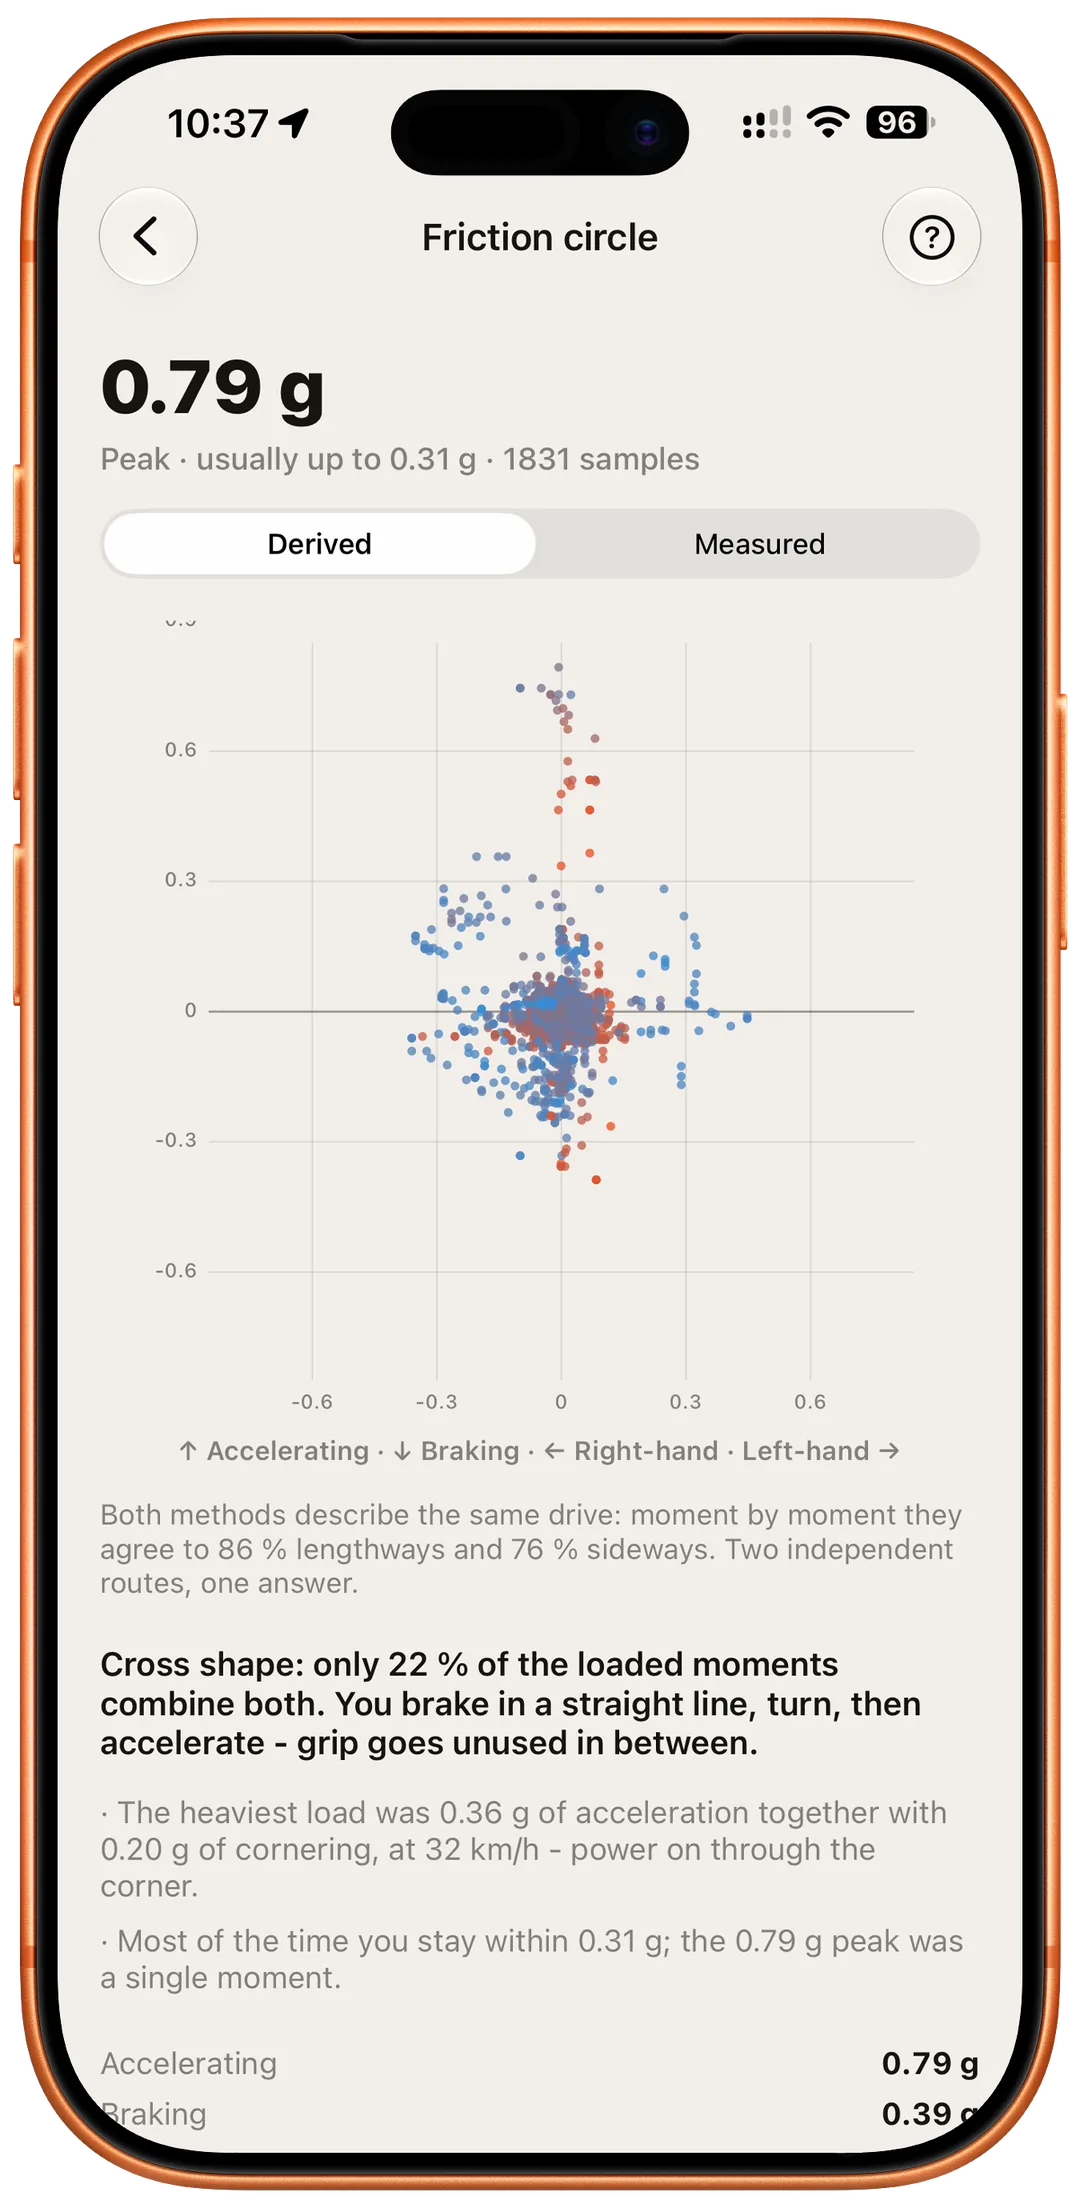
"Derived" from the GPS trace
Longitudinal acceleration follows from the change in speed. For lateral acceleration the app determines the radius through three positions. Points must be at least six metres apart, radius must be at least six metres and the examined span may not exceed two seconds. Below 8 km/h no g-value is produced because GPS scatter dominates; longitudinal or lateral components above 2 g are rejected as implausible. Nothing is calculated across recording gaps.
a_lat/g = (v² / r) / 9.80665
r = a × b × c / (4A)
g_combined = √(g_long² + g_lat²)
"Measured" with the accelerometer
The sensor measures in the phone's coordinate system and includes gravity. Its direction is estimated in segments of up to five minutes. The vehicle's longitudinal axis is then the direction whose sensor acceleration best matches the GPS speed change. The phone therefore does not need to be aligned, but must not move while driving.
Both methods are compared moment by moment. Agreement is an independent check; clear deviations can point to poor reception, a moving phone or vehicle body roll.
How the summary is built
“Usually up to” is the 95th percentile of combined load. For the share of combined moments the app only considers samples at or above 0.15 g total load; longitudinal and lateral components must each contribute at least 0.10 g. This keeps noise around the origin from dominating the result.
QUALITYGreen, limited or invalid
Green means accuracy, time spacing and plausibility were all in the good range. Yellow is a mathematically valid result with increased uncertainty, for instance from a larger data gap. The weakest part quality determines the overall status.
Invalid can mean, among other things: target not reached, no confirmed standstill, threshold not crossed from below, data gap, rejected fix or an implausible jump. The status is stored with the drive and therefore stays verifiable later.
Documented formulas and validation rules make processing auditable. They are not a calibration certificate and do not replace an uncertainty budget for the particular setup or homologated, laboratory-calibrated instrumentation.
Another specific edge case?
The FAQ takes every answer straight from the app's own reference.